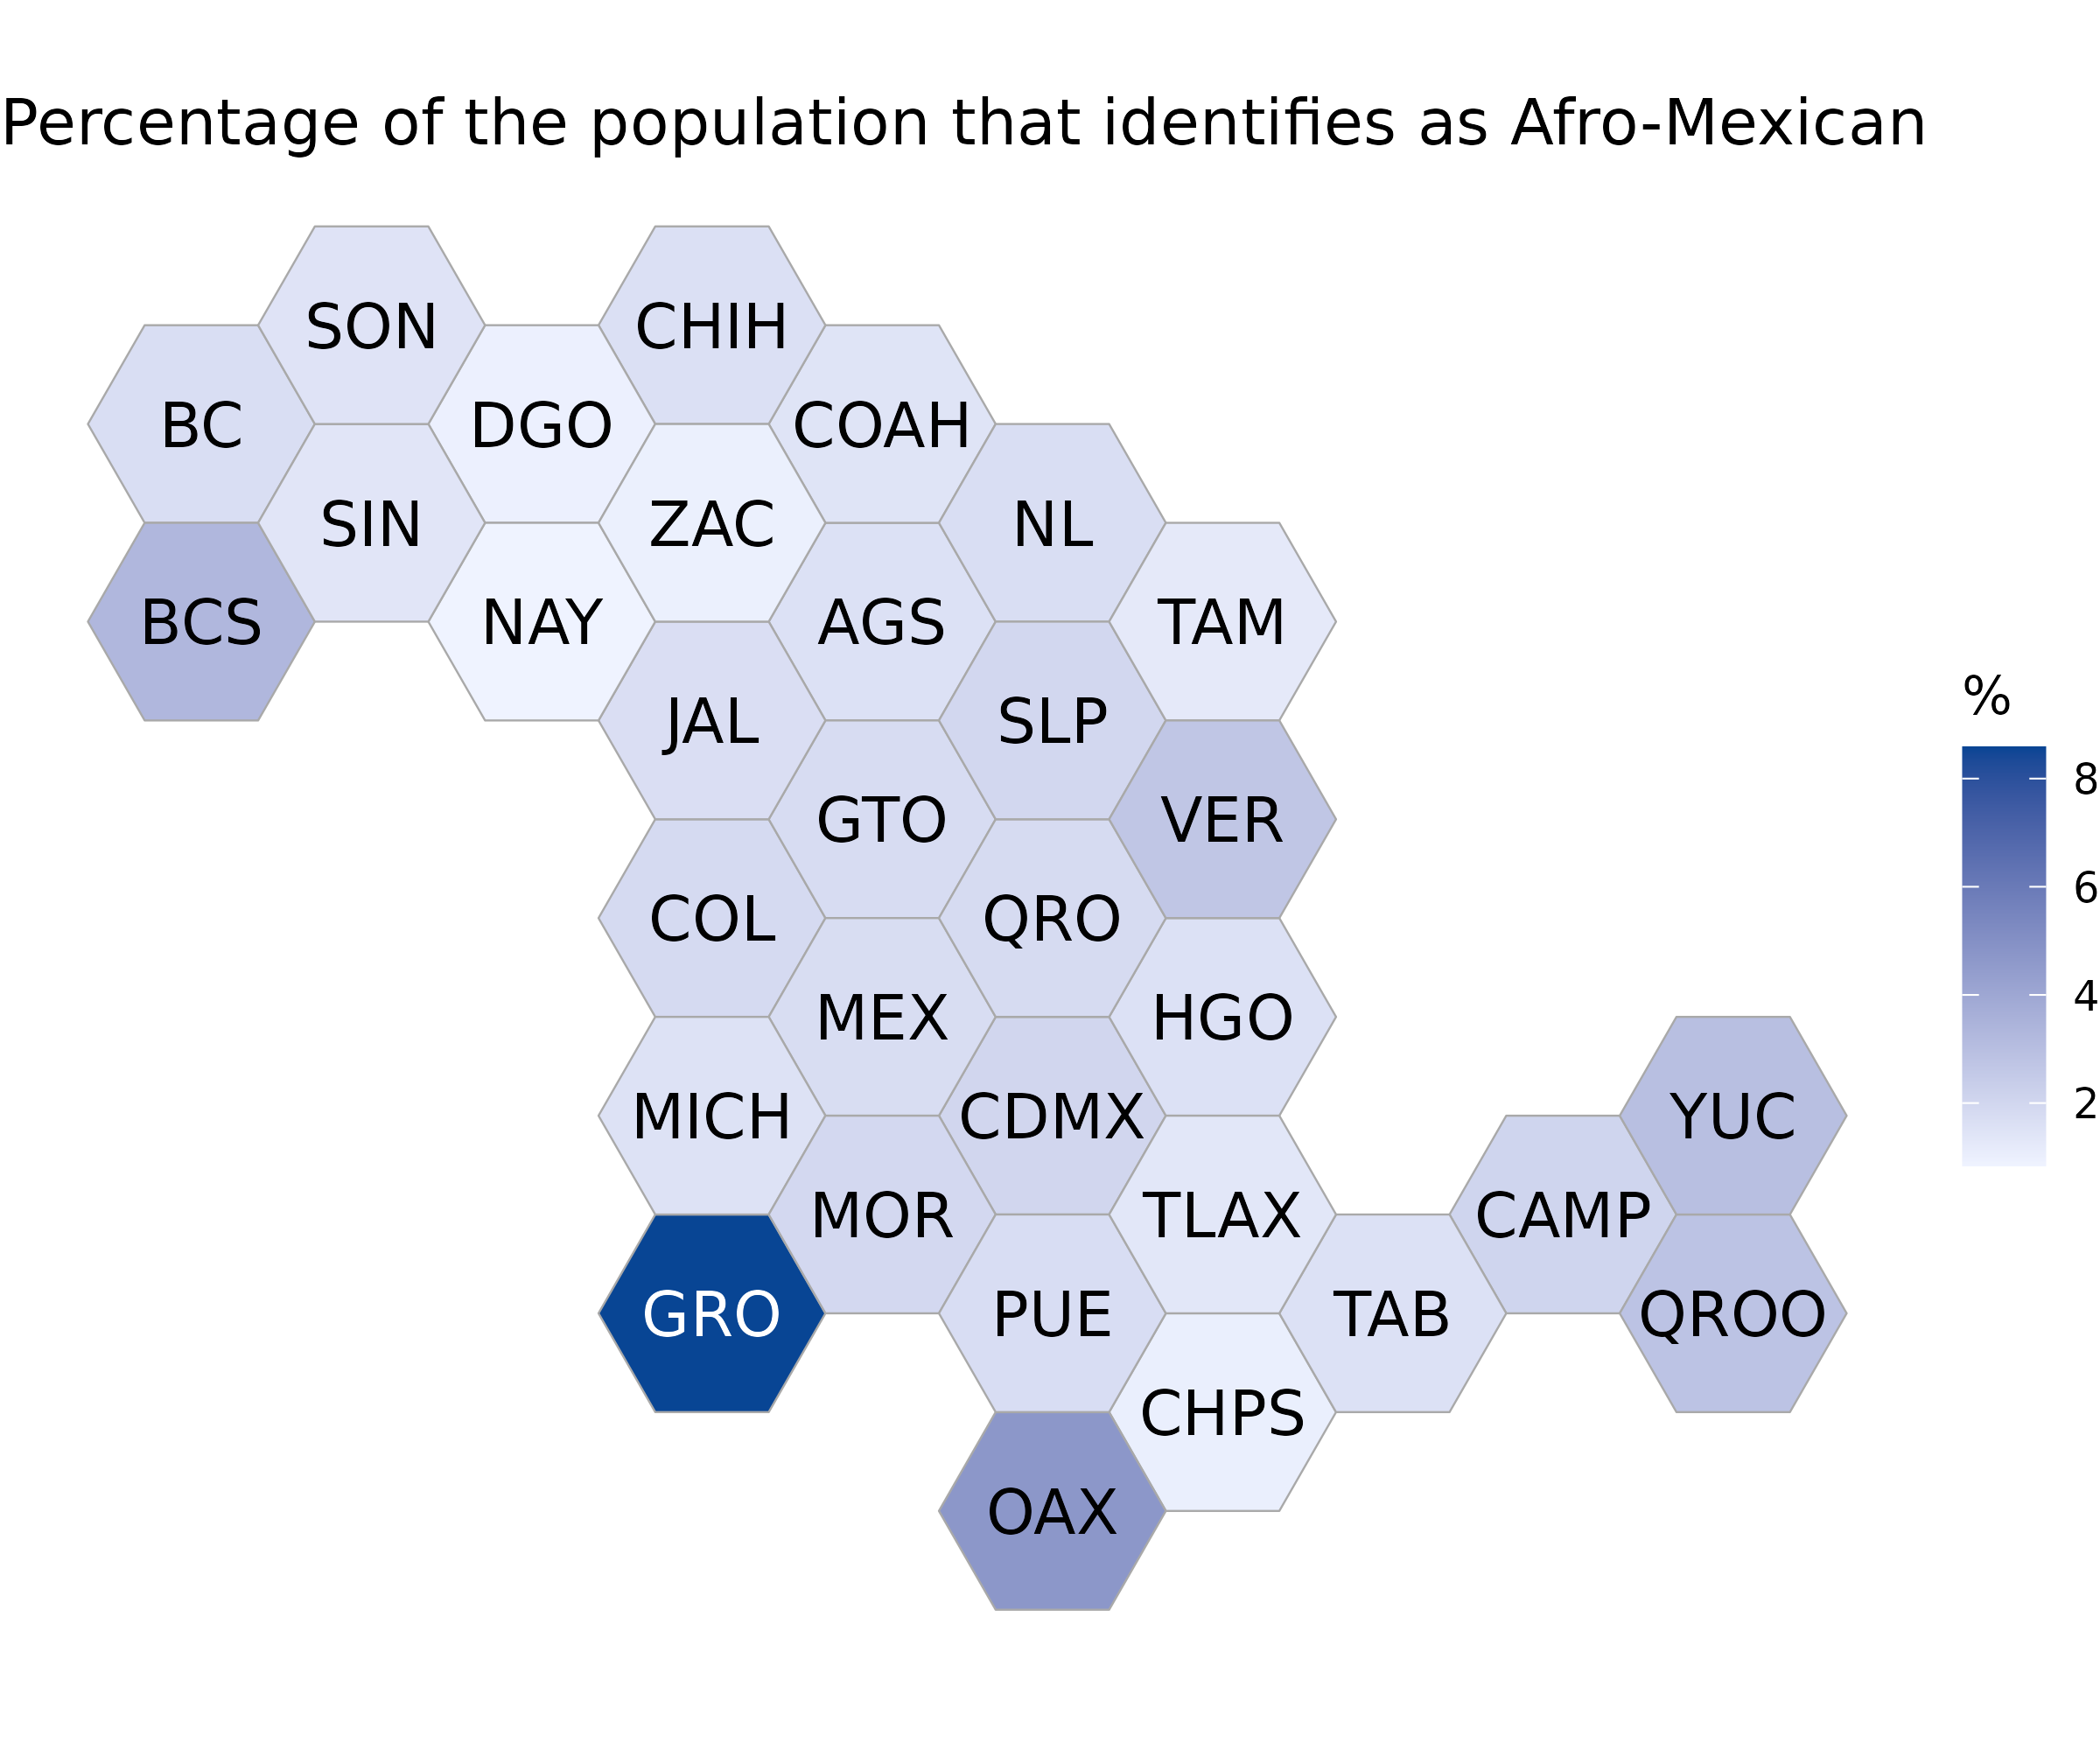
This document demonstrates how to create hexbin choropleth maps of
Mexican states using the mxmaps package. The examples show
how to visualize data on a hexbin grid, customize the appearance of
state labels with different colors and shadows, and use an automatic
contrast feature to ensure text readability against varying background
colors.
library("mxmaps")

data("df_mxstate_2020")
df_mxstate_2020$value <- df_mxstate_2020$afromexican / df_mxstate_2020$pop * 100
mxhexbin_choropleth(df_mxstate_2020,
  num_colors = 1,
  title = "Percentage of the population that identifies as Afro-Mexican",
  legend = "%",
  auto_contrast = TRUE
)
Text Shadow
You can use label_color if you want the state
abbreviations in a different color than the default black, and you can
also add a shadow_color if you want to the state
abbreviation labels to have a shadow to better distinguish them from the
background colors.
library("viridis")
library("scales")

df_mxstate_2020$value <- df_mxstate_2020$afromexican / df_mxstate_2020$pop
# Will show a warning, look at the municipio examples to see how to remove it
mxhexbin_choropleth(df_mxstate_2020,
  num_colors = 1,
  label_color = "white",
  shadow_color = "black",
  title = "Percentage of the population that identifies as Afro-Mexican",
  legend = "%",
  label_size = 3.8
) +
  scale_fill_viridis("percentage", labels = percent)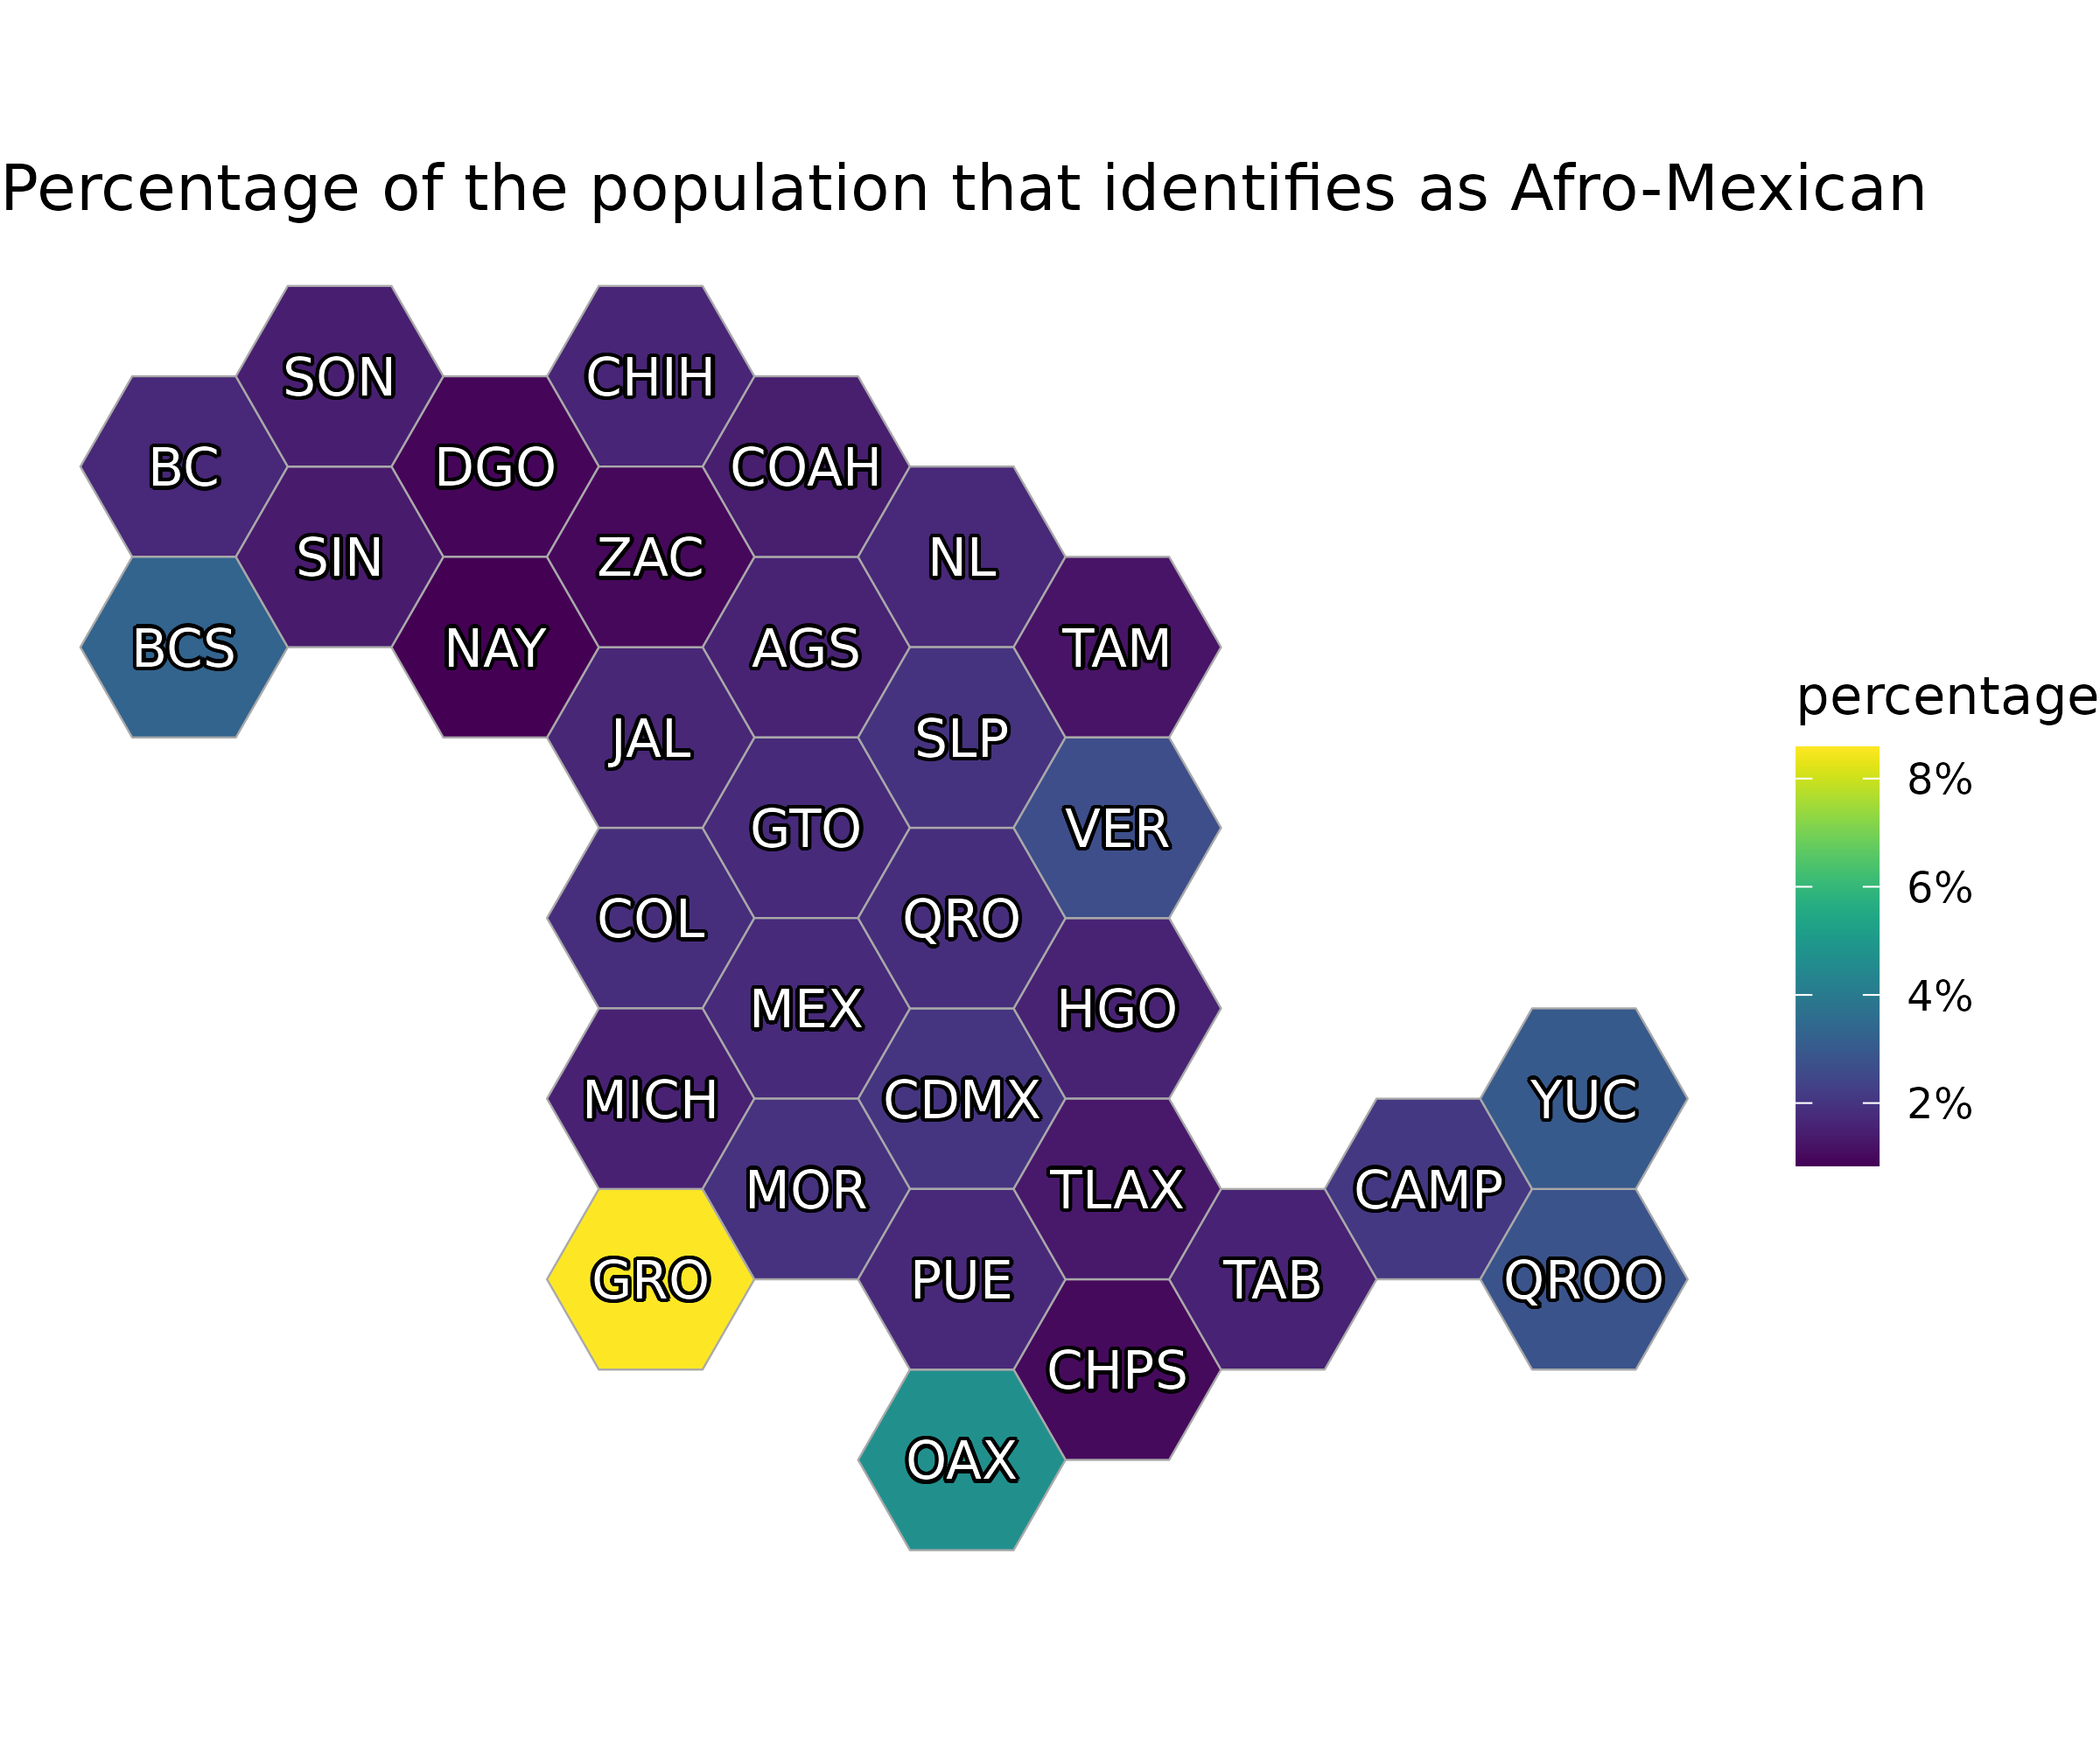
Auto Contrast
In your maps, you may encounter situations where the background color
changes dynamically, making it difficult to read text in a single color.
In such cases, you can use the automatic text color adjustment feature
auto_constrast to improve readability. This feature
automatically adjusts the text color based on the background color,
ensuring optimal readability.
library("viridis")
library("scales")

df_mxstate_2020$value <- df_mxstate_2020$afromexican / df_mxstate_2020$pop
mxhexbin_choropleth(df_mxstate_2020,
  num_colors = 1,
  title = "Percentage of the population that identifies as Afro-Mexican",
  legend = "%",
  shadow_color = "#111111",
  auto_contrast = TRUE
) +
  scale_fill_viridis()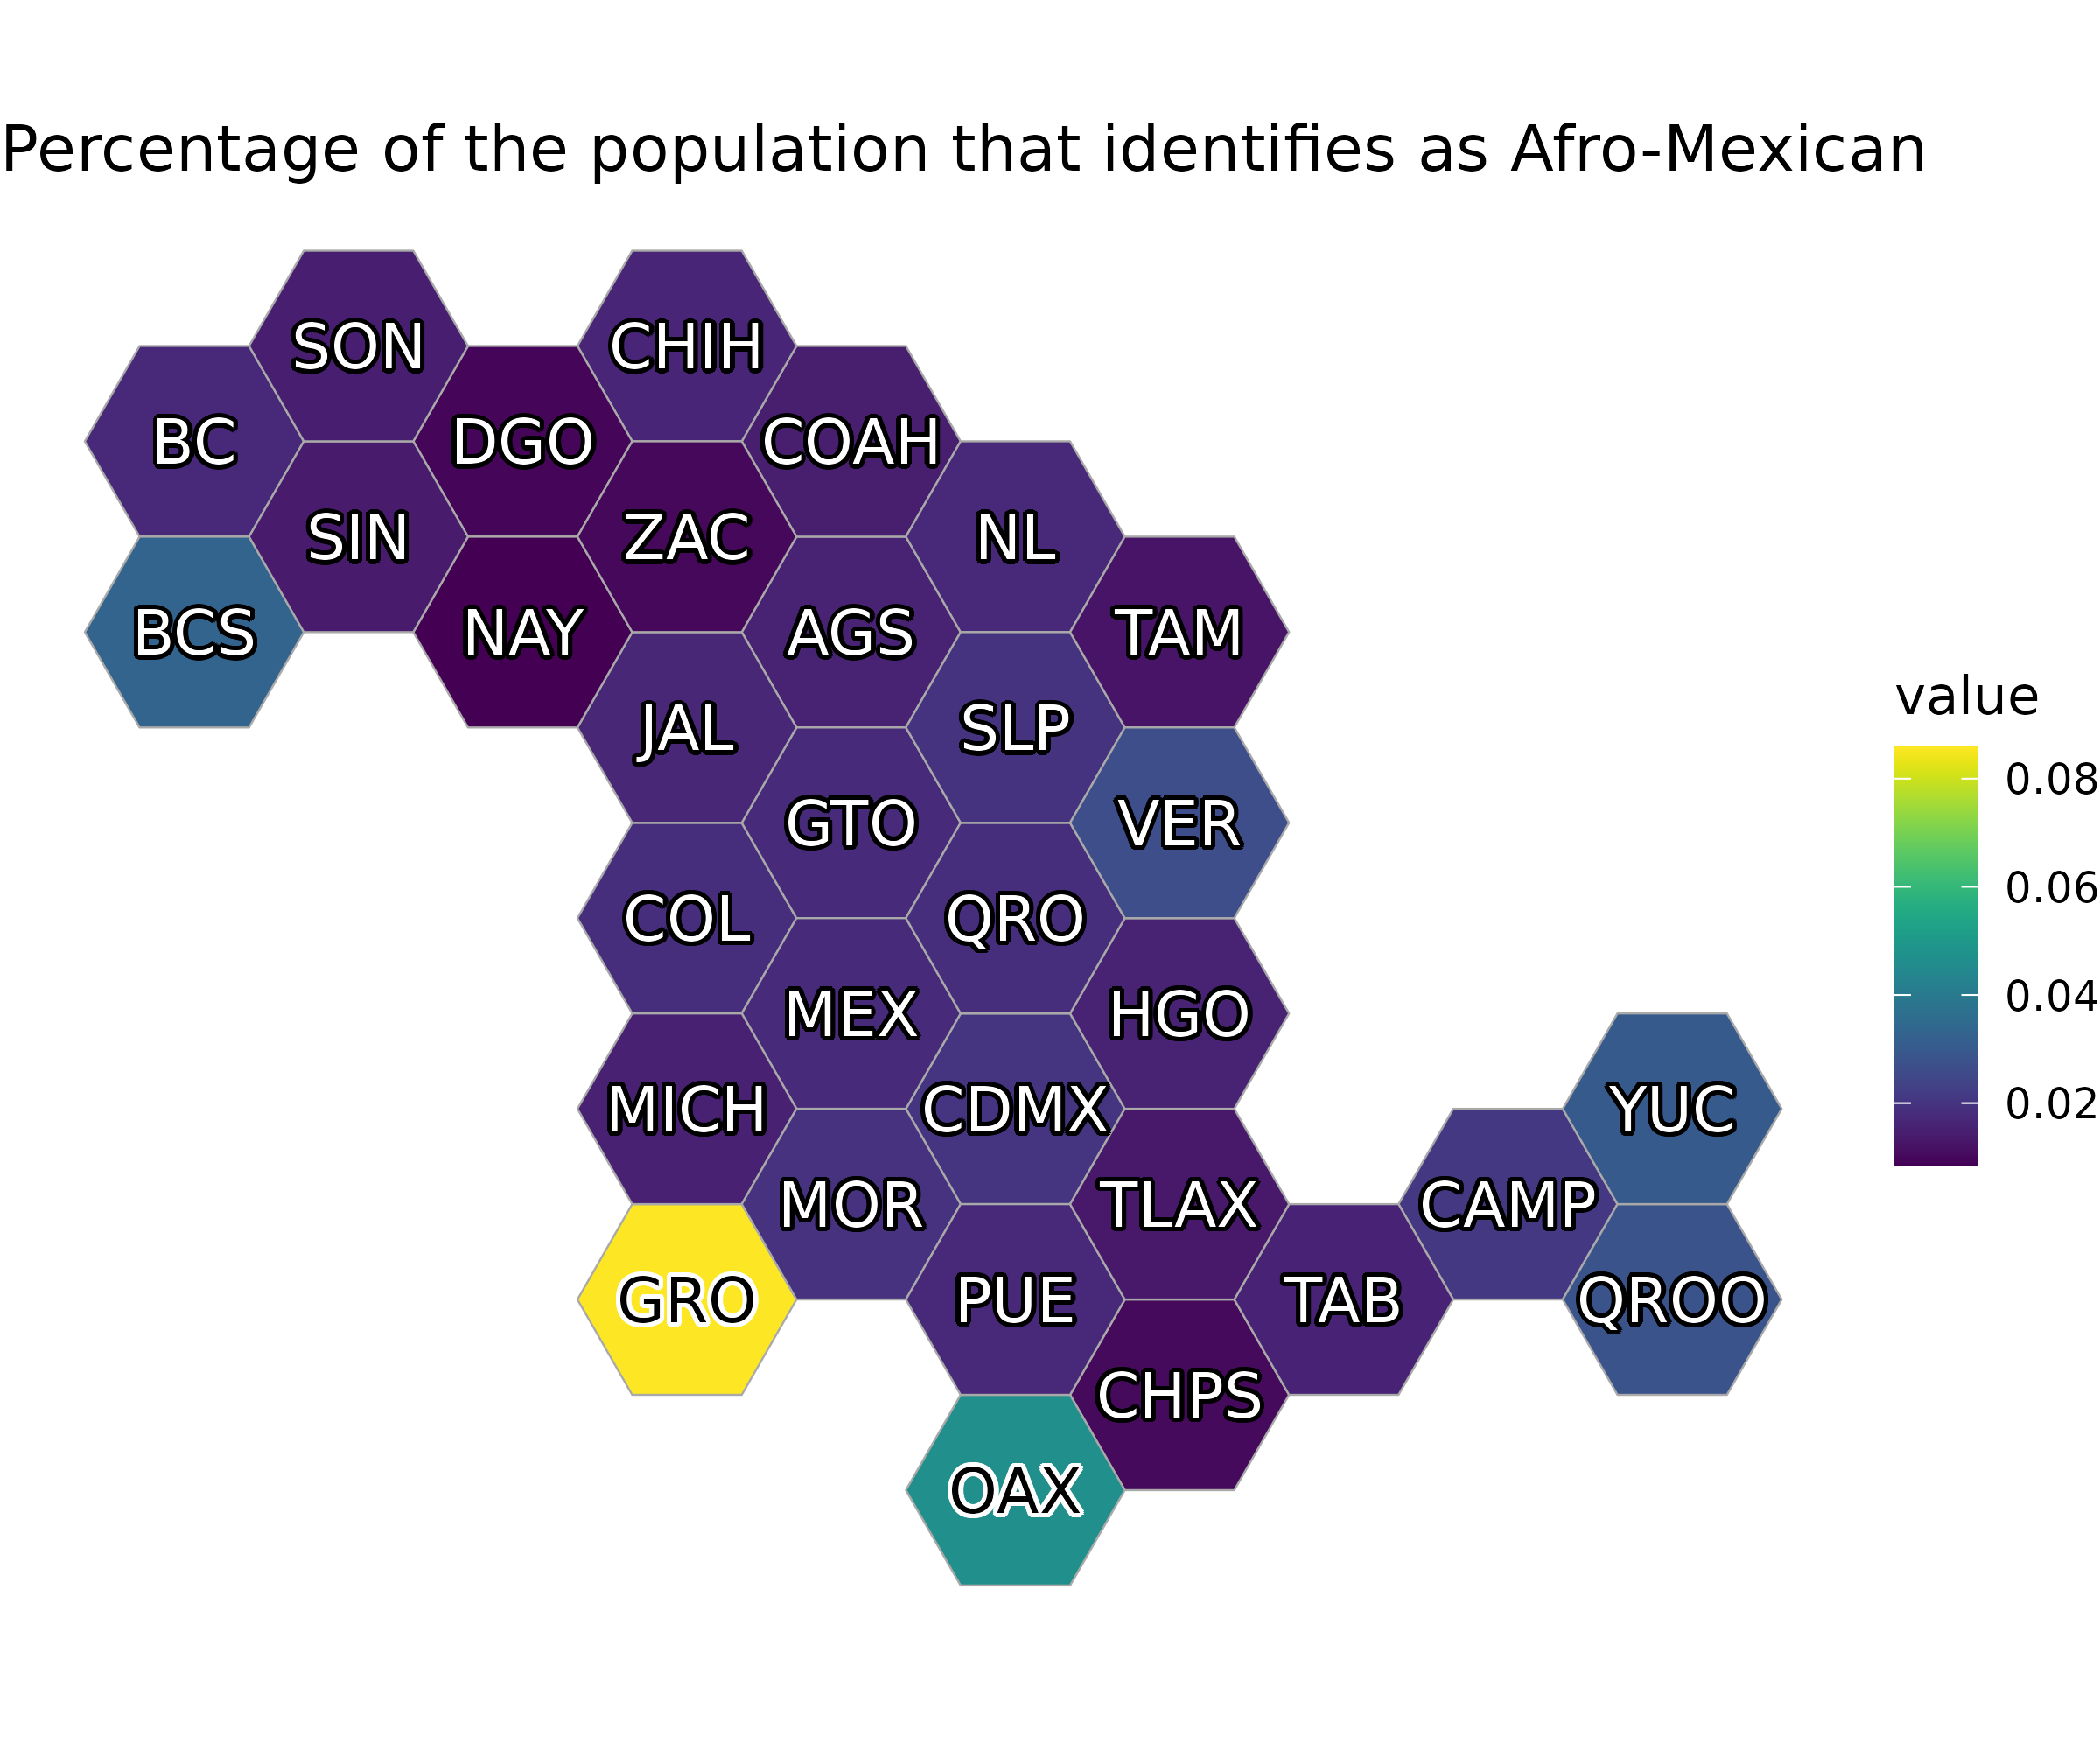
Note how the label colors for GRO and OAX are black with a white outline
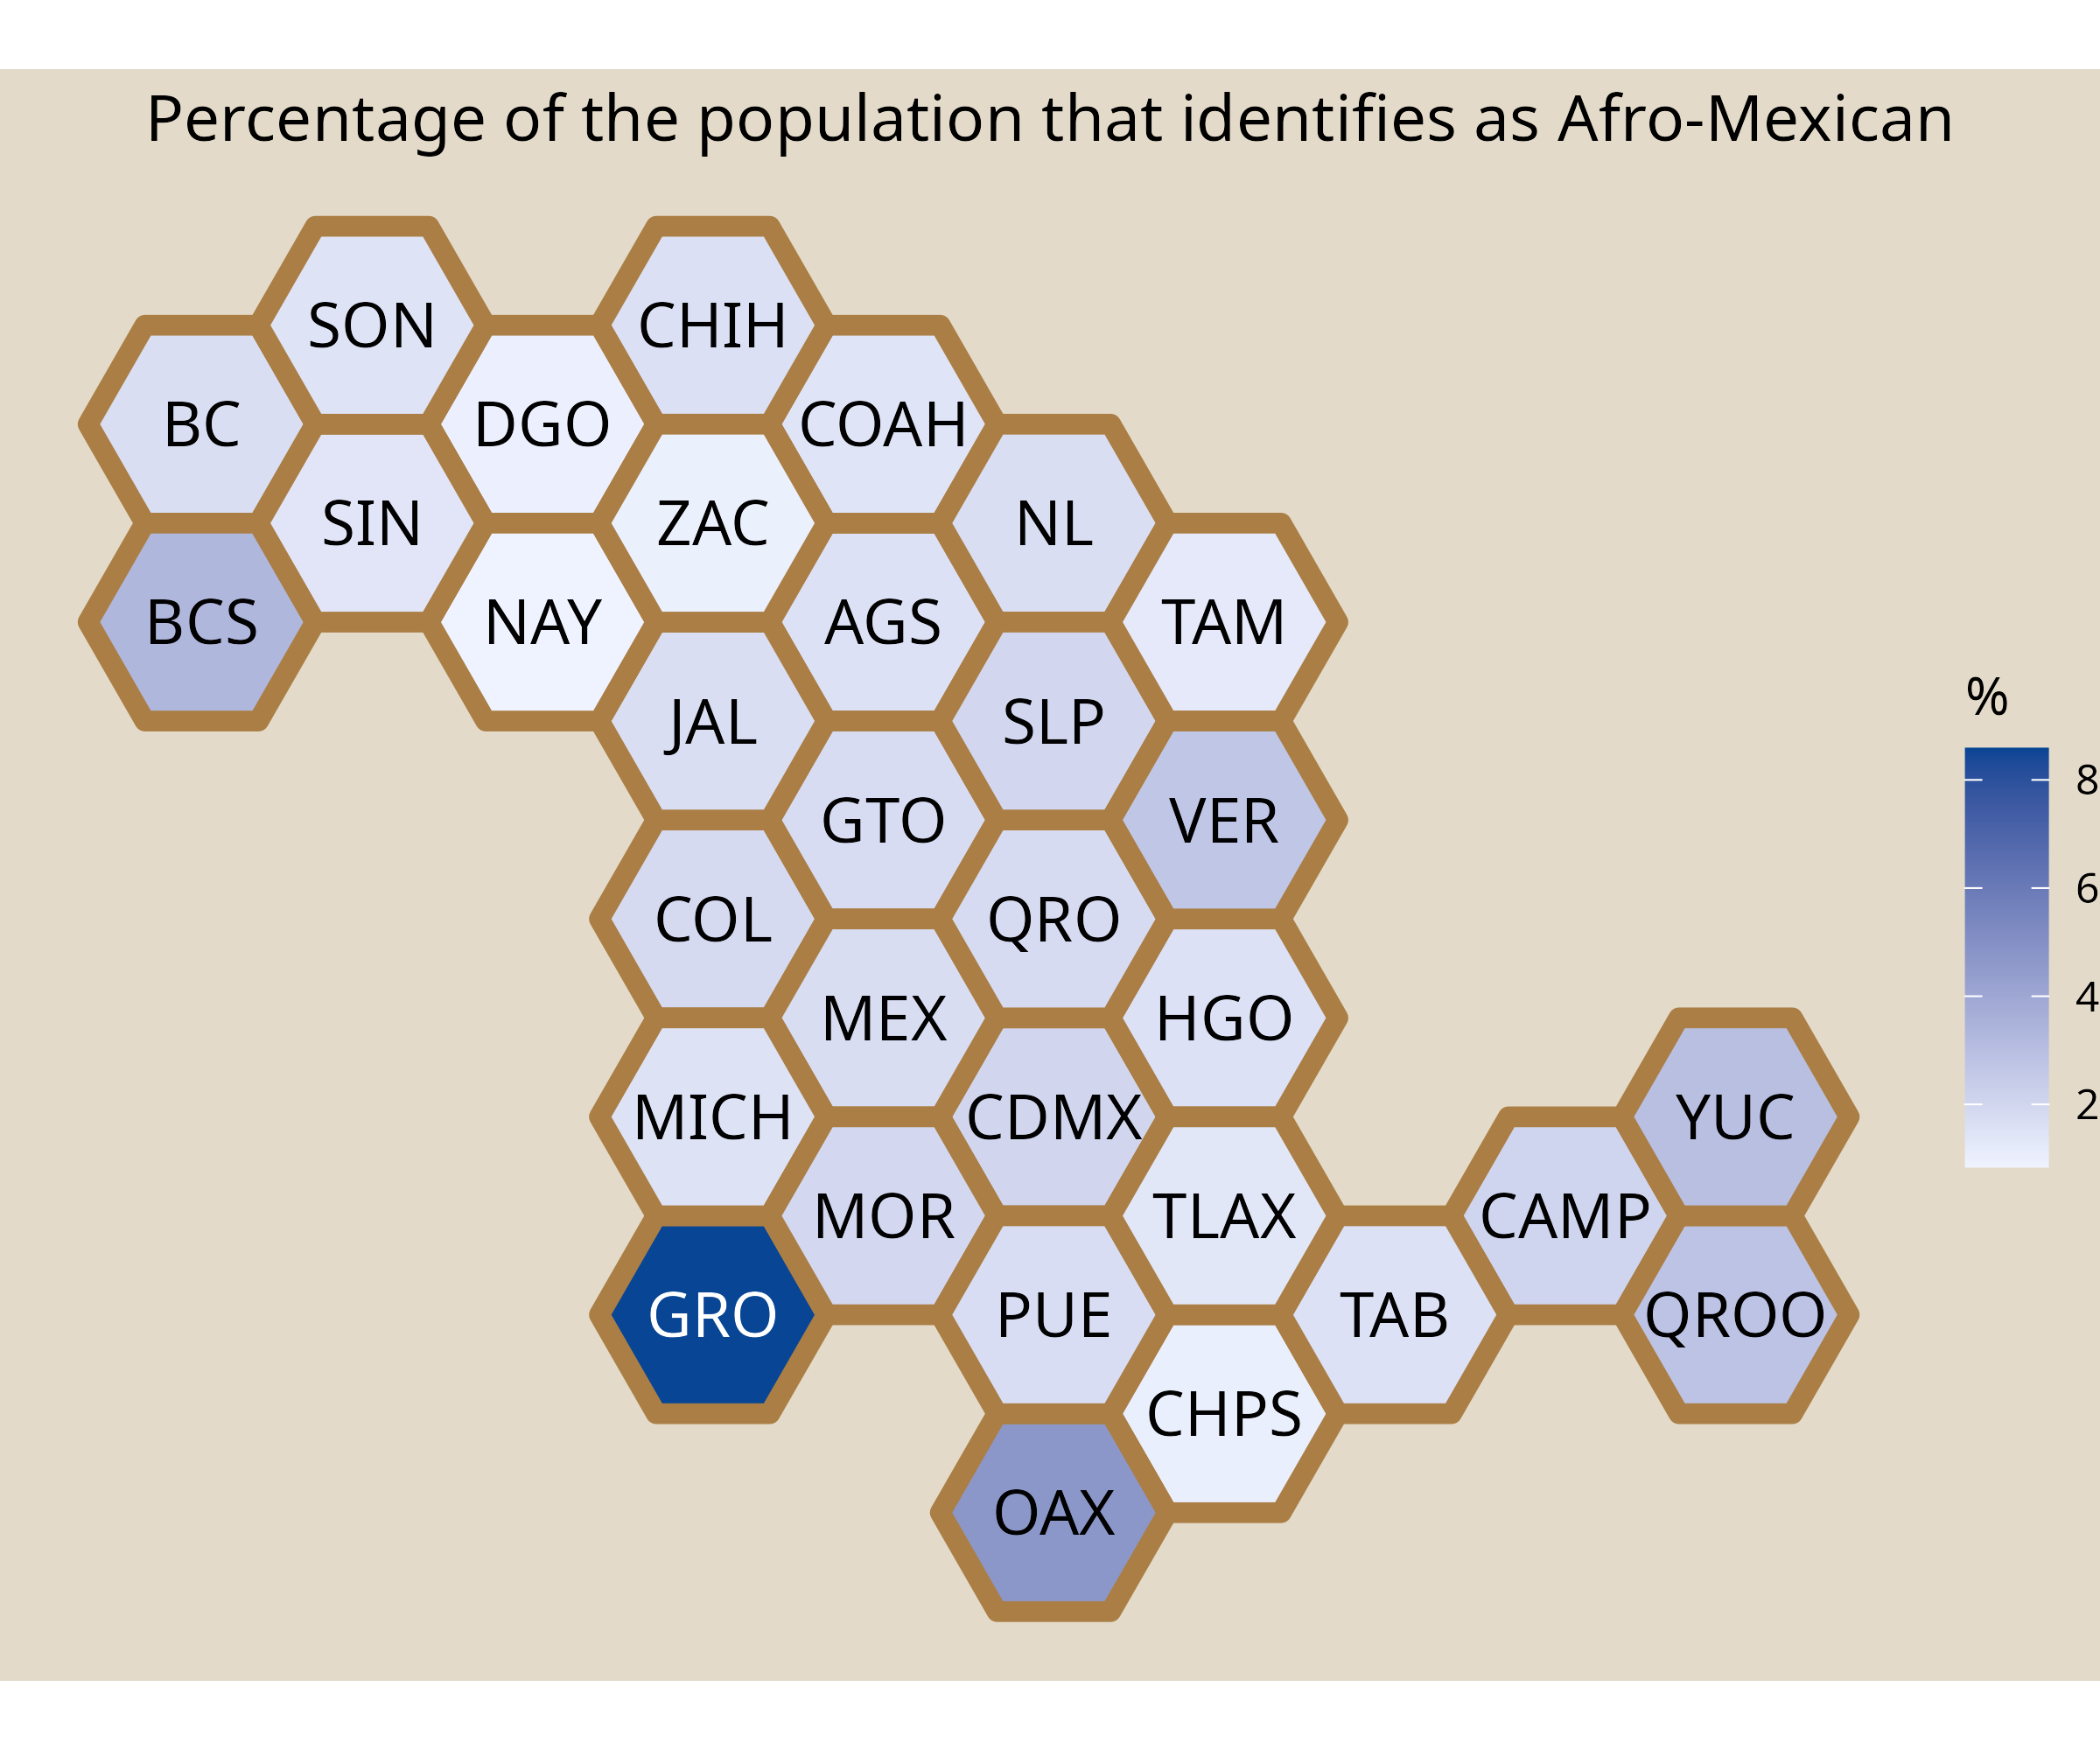
Title and Background Colors
df_mxstate_2020$value <- df_mxstate_2020$afromexican / df_mxstate_2020$pop * 100
mxhexbin_choropleth(df_mxstate_2020,
  num_colors = 1,
  title = "Percentage of the population that identifies as Afro-Mexican",
  legend = "%",
  auto_contrast = TRUE,
  background_color = "#e3dac9",
  state_border_size = 2,
  state_border_color = "#AA7E44"
)