![]()
![]()
![]()
This R package easily creates choropleth maps of Mexico at both the state and municipio levels. It is based on the choroplethr package and includes functions to create interactive maps with Leaflet, and to format strings to match INEGI state and municipio codes. If you have questions, please visit the discussion forum.
Installation
This package is currently only available on GitHub. To install, run the following command:
if (!require("devtools")) {
    install.packages("devtools")
}
devtools::install_github("diegovalle/mxmaps")
Note: mxmaps depends on the sf package, which has its own system dependencies.
Quick Example
library("mxmaps")

df_mxstate_2020$value <- df_mxstate_2020$pop
mxstate_choropleth(df_mxstate_2020,
                   title = "Total population, by state")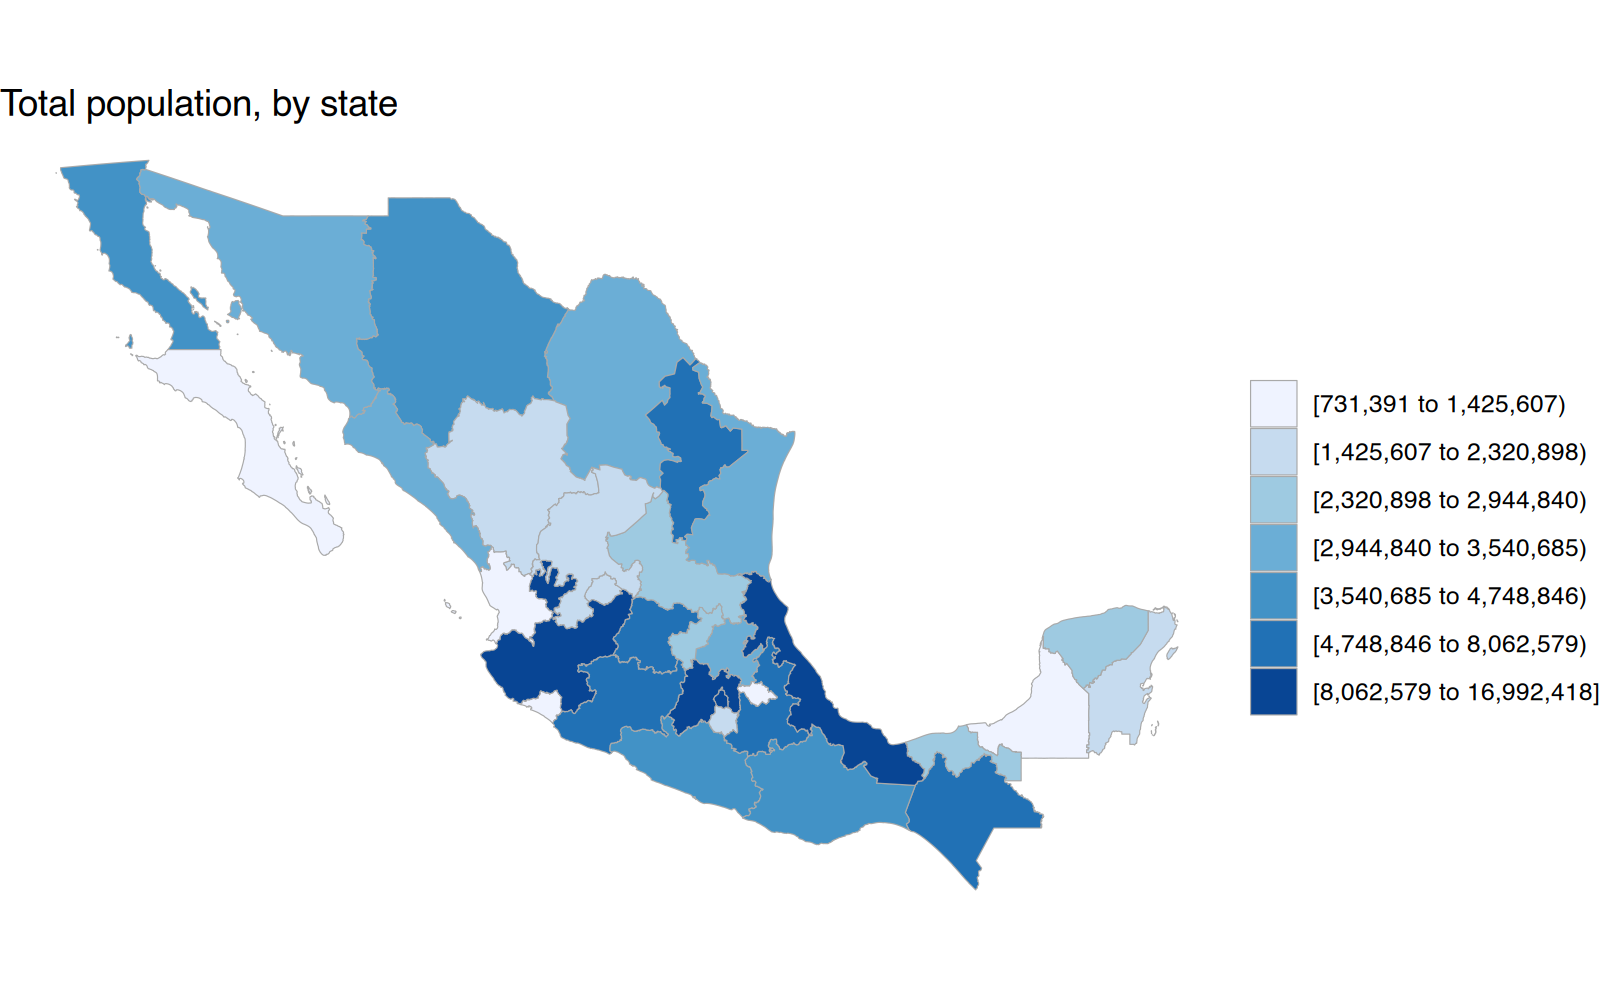
Here is a preview of the data format:
| region | value |
|---|---|
| 01 | 1425607 |
| 02 | 3769020 |
| 03 | 798447 |
| 04 | 928363 |
| 05 | 3146771 |
| 06 | 731391 |
Basic Usage
The two main functions in this package are mxstate_choropleth and mxmunicipio_choropleth. The data.frame provided to these functions must contain a region column with INEGI state or municipio codes, and a value column with the values to plot. You can set the map’s title with the title parameter and the number of color buckets with the num_colors parameter. To use a continuous color scale, set num_colors = 1.
library("mxmaps")

df_mxstate_2020$value <-  df_mxstate_2020$indigenous_language /
  df_mxstate_2020$pop * 100
mxstate_choropleth(df_mxstate_2020,
                   num_colors = 1,
                   title = "Percentage of the population that speaks\nan indigenous language",
                   legend = "%")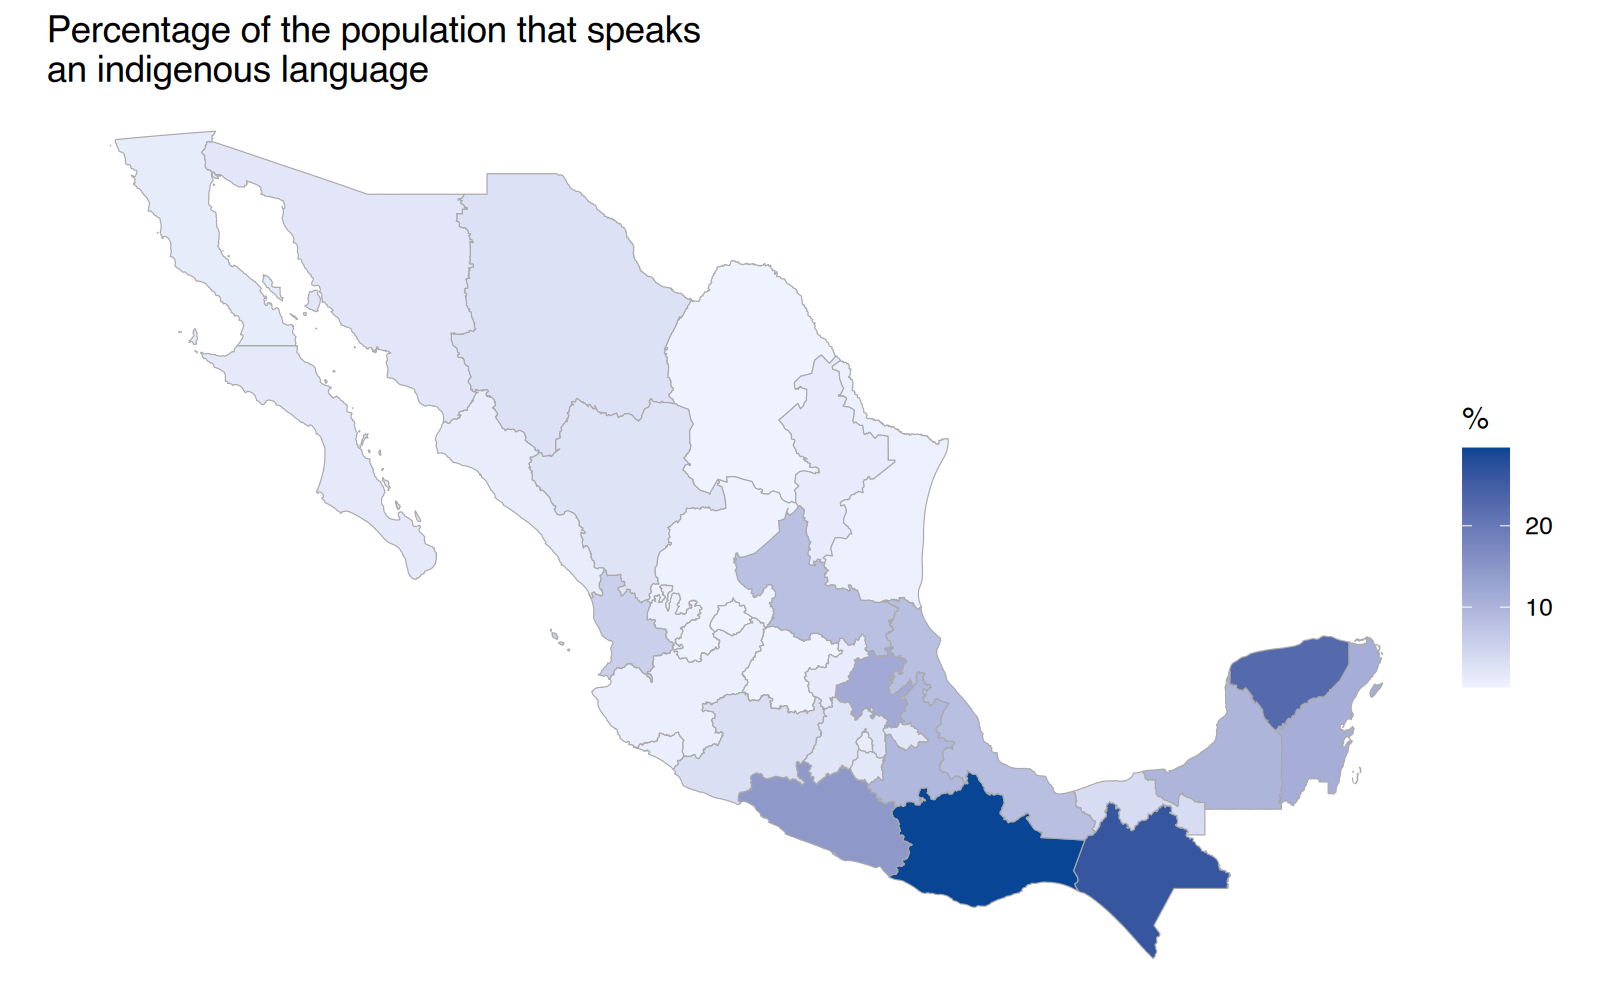
Municipios
You can also plot data for Mexican municipios (which are similar to US counties).
data("df_mxmunicipio_2020")
df_mxmunicipio_2020$value <-  df_mxmunicipio_2020$indigenous_language /
  df_mxmunicipio_2020$pop * 100
mxmunicipio_choropleth(df_mxmunicipio_2020,
                       num_colors = 1,
                       title = "Percentage of the population that speaks\nan indigenous language",
                       legend = "%")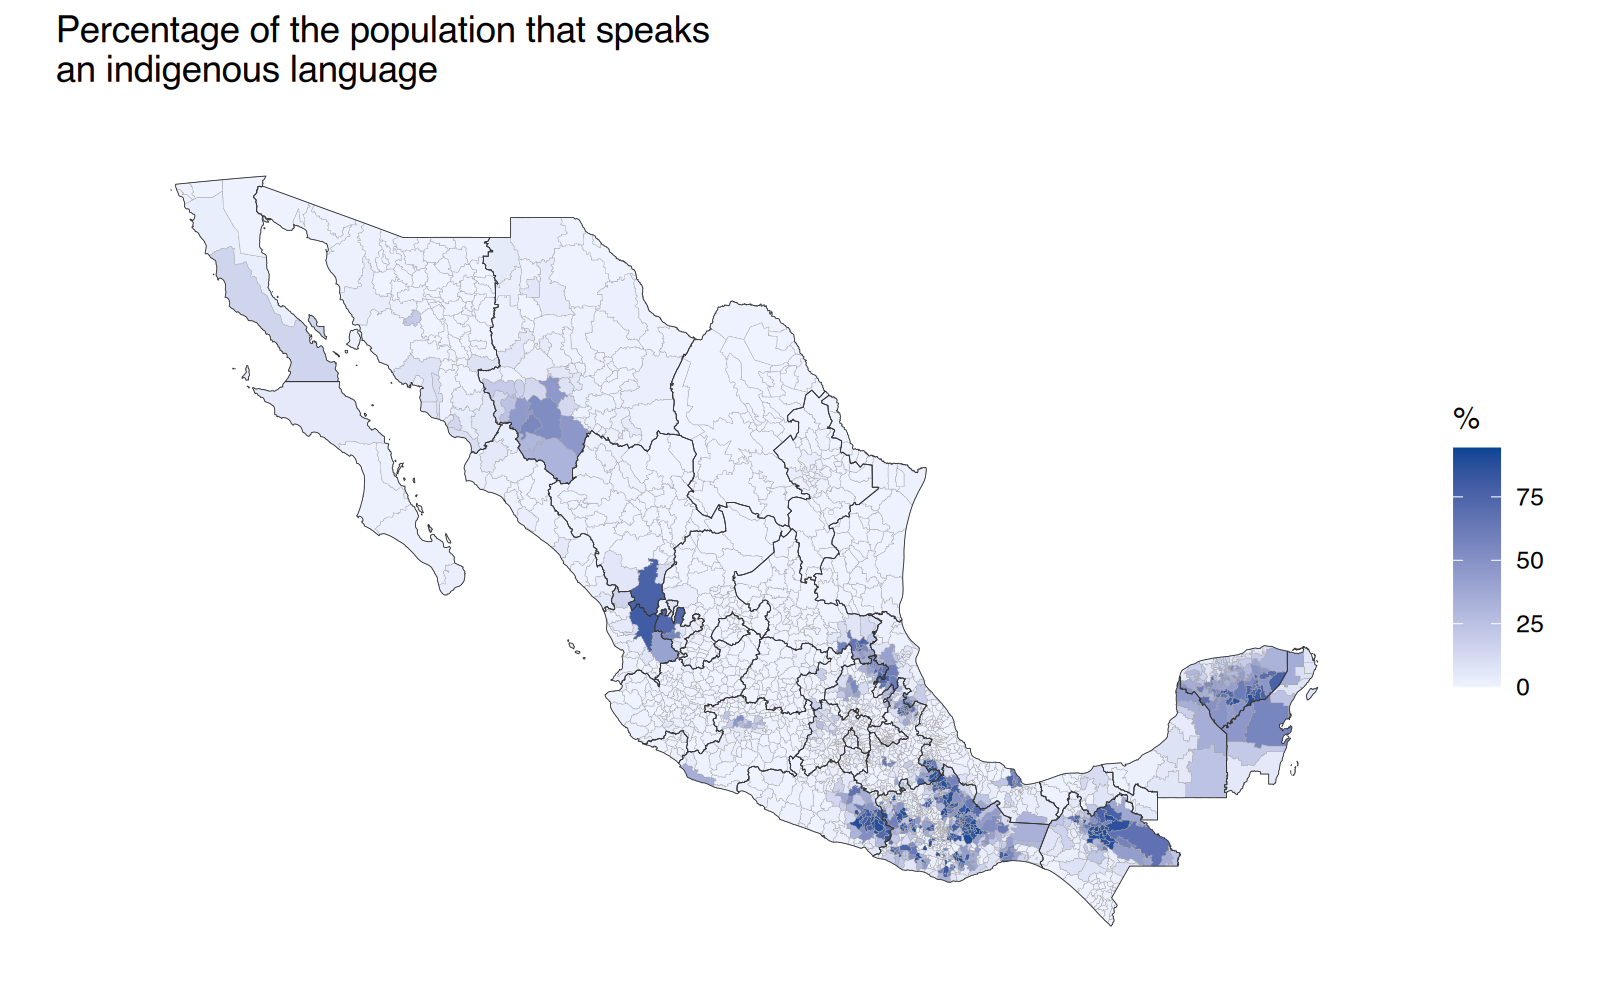
You can also zoom in on specific areas of the map by passing a vector of region codes to the zoom parameter:
mxmunicipio_choropleth(df_mxmunicipio_2020, num_colors = 1,
                       zoom = subset(df_mxmunicipio_2020, metro_area %in%
                                       c("Valle de México",
                                         "Puebla-Tlaxcala",
                                         "Cuernavaca",
                                         "Toluca"))$region,
                       title = "Percentage of the population that speaks\nan indigenous language",
                       legend = "%")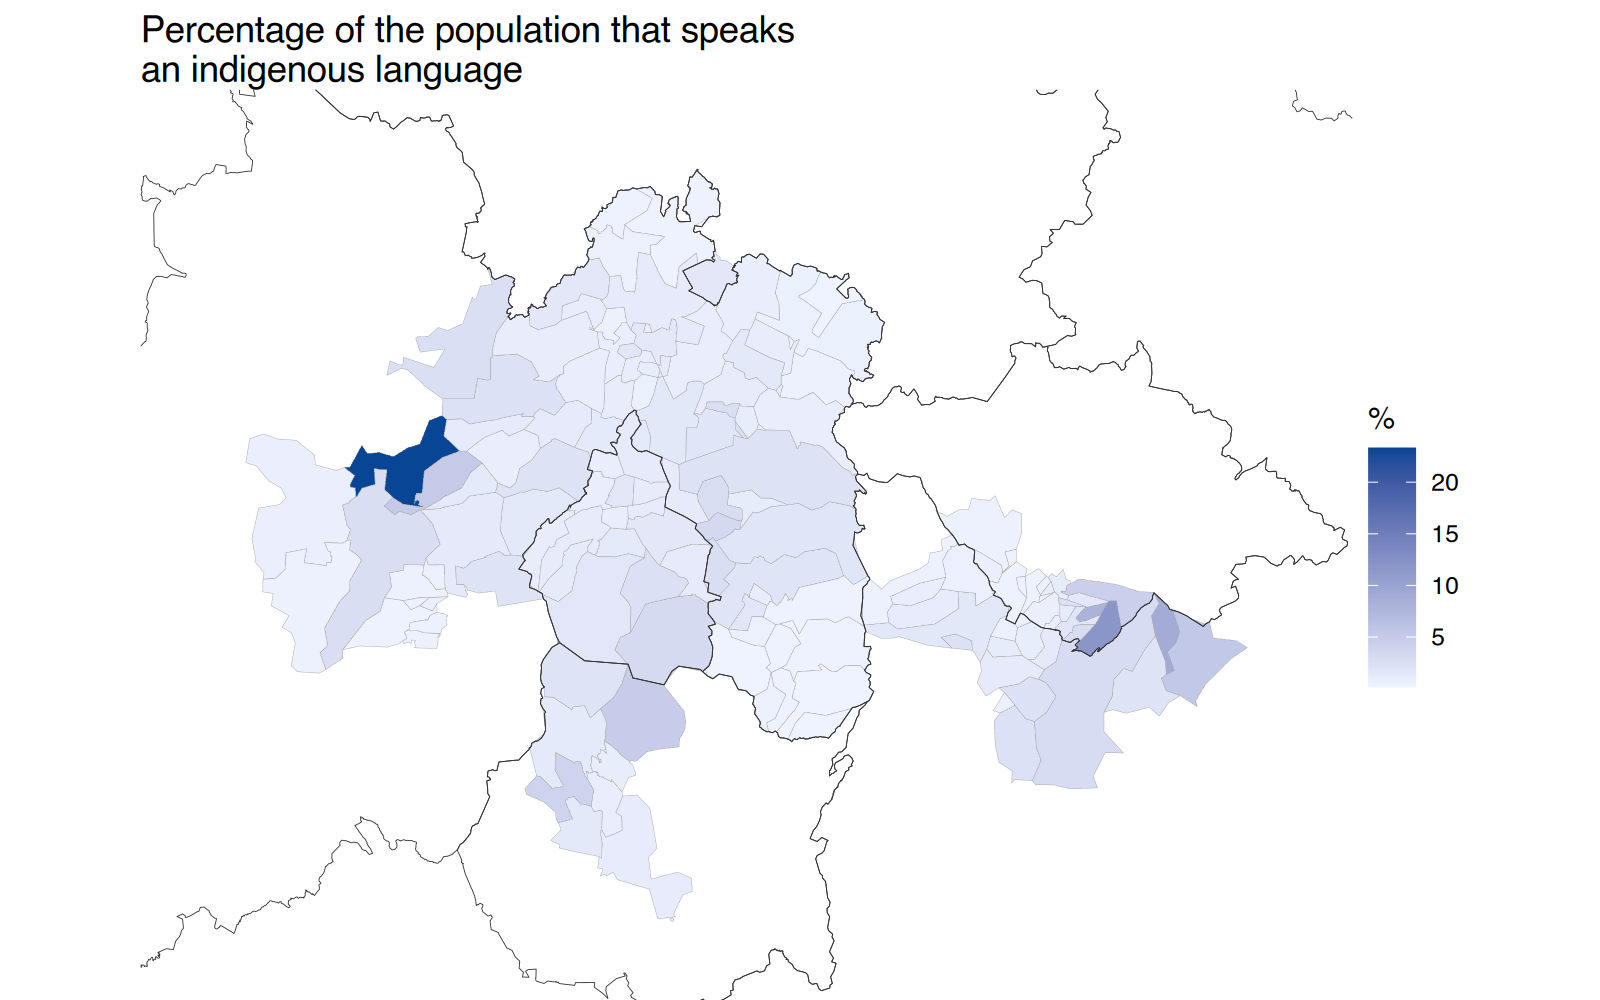
The show_states parameter allows you to hide state borders on municipio-level maps.
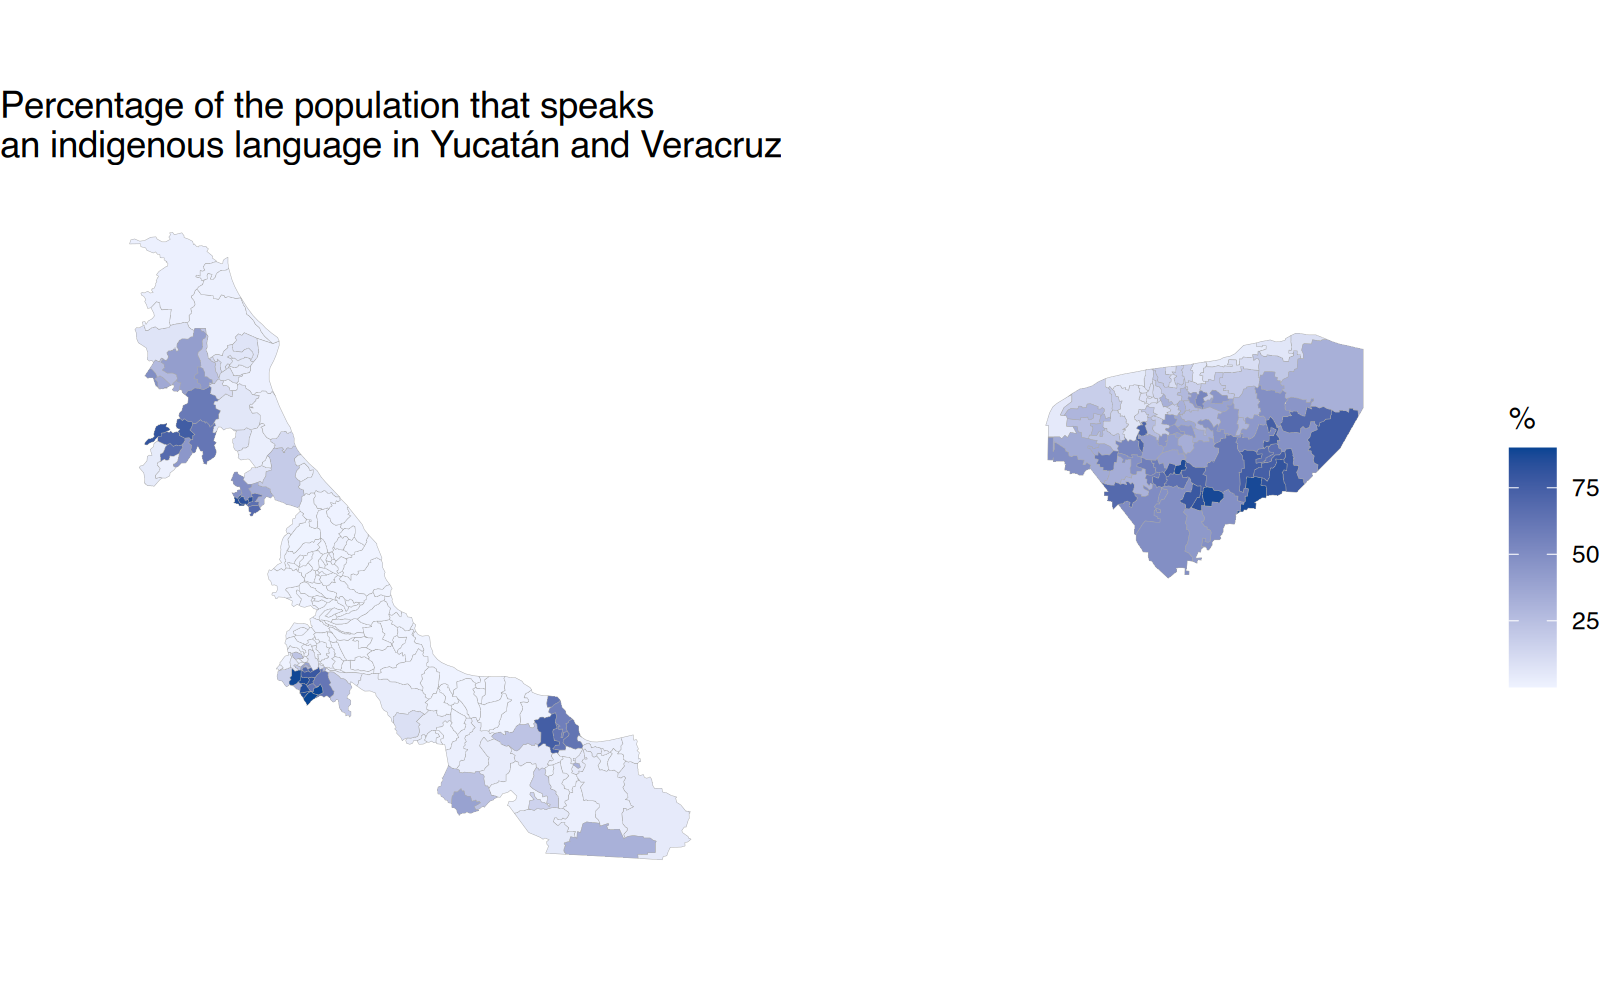
mxmunicipio_choropleth(df_mxmunicipio_2020, num_colors = 1,
                       zoom = subset(df_mxmunicipio_2020, state_name %in%
                                       c("Yucatán", "Veracruz"))$region,
                       title = "Percentage of the population that speaks\nan indigenous language in Yucatán and Veracruz",
                       show_states = FALSE,
                       legend = "%")