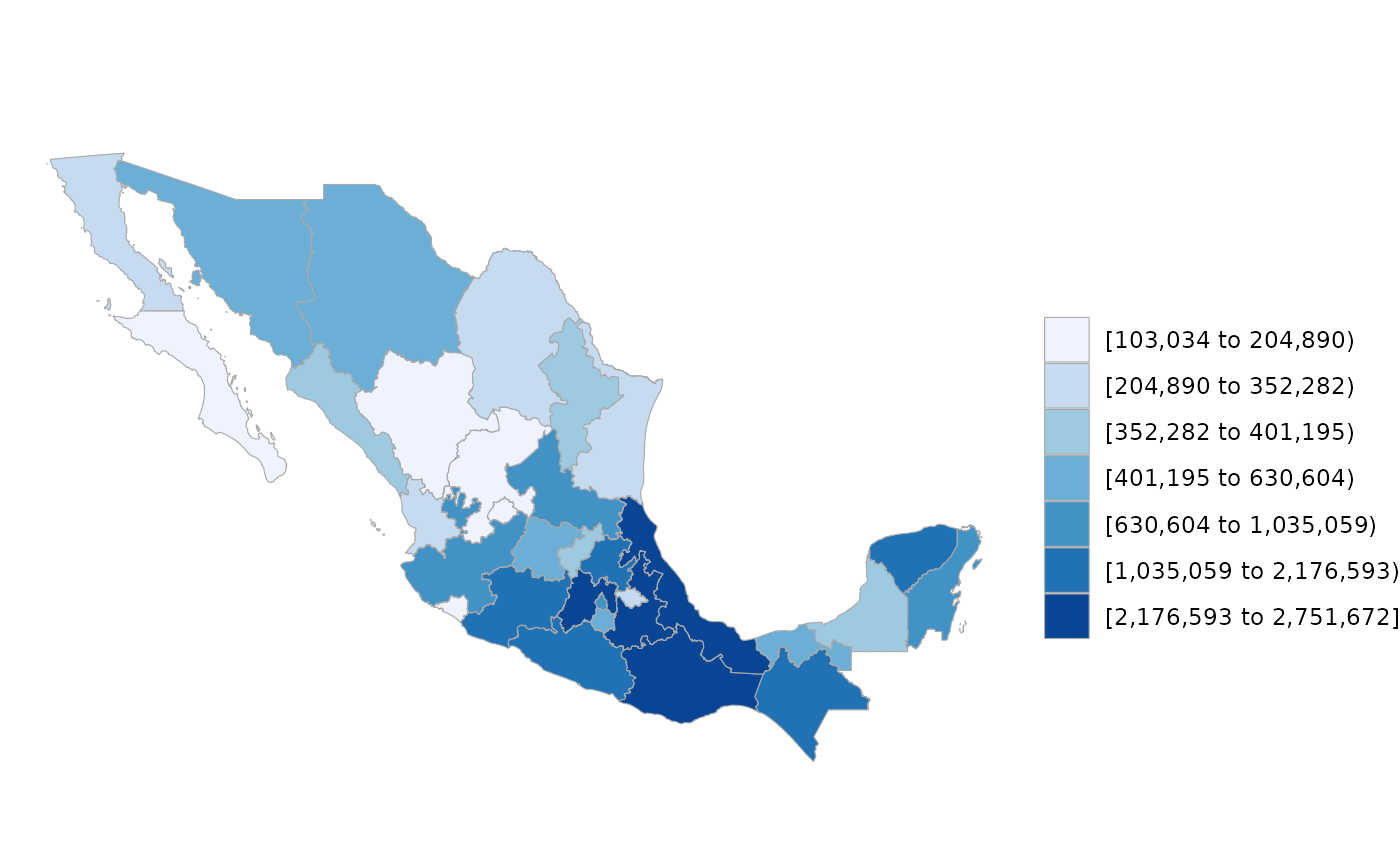
The map used is mxstate.map. See ?mxstate.map for for more information.
Usage
mxstate_choropleth(
  df,
  title = "",
  legend = "",
  num_colors = 7,
  zoom = NULL,
  background_color = "white",
  state_border_color = "dark grey",
  state_border_size = 0.2,
  title_color = "black",
  title_align = 0.5,
  title_position = "plot",
  scale_bar = FALSE,
  scale_bar_position = "bl",
  scale_bar_length = 500,
  scale_bar_segments = 5,
  scale_bar_height = 0.5,
  scale_bar_color = "black",
  scale_bar_text_color = "black"
)
Arguments
- df
A data.frame with a column named "region" and a column named "value". Elements in the "region" column must match the state numeric codes in the "region" column of ?df_mxstate. either with a leading zero or without one (e.g. "01" or "1")
- title
An optional title for the map.
- legend
An optional name for the legend.
- num_colors
The number of colors to use on the map. A value of 1 will use a continuous scale, and a value in [2, 9] will use that many colors.
- zoom
An optional vector of countries to zoom in on. Elements of this vector must exactly match the names of countries as they appear in the "region" column of ?country.regions
- background_color
Background color of the map and legend.
- state_border_color
Border color of polygons.
- state_border_size
Border line width.
- title_color
Title text color.
- title_align
Horizontal justification of title.
- title_position
Either "plot" or "panel".
- scale_bar
Logical; draw a scale bar.
- scale_bar_position
Position of scale bar: "bl", "br", "tl", or "tr".
- scale_bar_length
Scale bar length in kilometers.
- scale_bar_segments
Number of scale bar segments.
- scale_bar_height
Height of scale bar.
- scale_bar_color
Scale bar outline and fill color.
- scale_bar_text_color
Scale bar text color.